A marine stratocumulus deck as a vertically pointing cloud radar sees it over a few hours. Drizzle forms in the thicker parts of the cloud, and most of it evaporates before it reaches the sea surface.

Huan Li, PhD

I study rain and clouds from space: how satellites estimate precipitation, where those estimates fail, how aerosols and the marine boundary layer shape warm-cloud light rain, and what becomes of the drizzle satellite miss, most of which evaporates before it reaches the surface.

Remote sensing scientist, College Park, MD

My research began with rain-gauge observations and developed a variational scheme merging gauge and satellite precipitation; then characterized the error structure of the satellite products IMERG, TMPA, CMORPH, and GSMaP over Tibetan Plateau. It next turn to warm-cloud light rain that passive sensors often miss, first detecting it with CloudSat, MODIS, and VIIRS and then quantifying its aerosol and marine boundary-layer controls with ARM ENA ground-based radar. It now combines EarthCARE CPR, the first spaceborne Doppler cloud radar, with ARM ENA radar to close the observational gap in the drizzle life cycle below the CPR clutter floor, and validates retrieved fall speeds and vertical air motion against NEXRAD dual-Doppler retrievals. I hold a Ph.D. in remote sensing from the Chinese Academy of Sciences and a B.S. in computer science.

Huan Li at the Testudo statue in front of McKeldin Library, University of Maryland.

One question, six stages

YearsFocusData & methodsQuestion and finding
2026–Air motion and fall speed in EarthCARE Doppler observationsEarthCARE CPR; NEXRAD dual-Doppler winds; ARM SGP disdrometersCan satellite-only methods separate air motion from fall speed? In quiet stratiform cloud, the ESA C-CD and DPR-based fall speeds hold. In convection, C-CD absorbs the air motion up to ~1.8 m s⁻¹, and the JAXA CPR_CLP fall speed is 3 m s⁻¹ too small in rain; the DPR-based method fails in high, cold snow.
2025–Marine warm-cloud drizzle life cycle~201 EarthCARE CPR overpasses; ARM ENA cloud radar, 1,585 radiosondes, ERA5; cloud regime classificationWhat sets how much drizzle forms, and whether it lands? Cloud-top height and LWP set generation; cloud-base drop size and sub-cloud depth set its fate.
2018–2023Warm rain and marine boundary-layer cloudsEleven years of ARM ENA cloud radar; CloudSat, MODIS, VIIRS; VIIRS–CloudSat collocationHow often do marine cloud warm rain, and what controls it? Drizzle scales with cloud thickness; warm-rain occurrence depends on effective radius and LWP.
2015–2016Satellite precipitation errors over landIMERG, GSMaP, CMORPH and TMPA against gauges and ground radar, over Tibetan PlateauHow do satellite errors vary with rain rate, terrain, season, and gauge density?
2012–2016Merging hourly satellite and gauge precipitationHourly CMORPH and gauges over China; two-dimensional variational analysis, with the satellite error setting the weightsCan satellite data fill the gaps between gauges? The merged analysis improves data-sparse regions and extreme rainfall.
2011Daily gauge precipitation analysis over China2,419 gauges, optimal interpolation on a 0.25° grid, 1951–2010How well can sparse gauges resolve orographic rain in the west?

Research

Air motion and fall speed in EarthCARE Doppler observations

A ground-based dual-Doppler reference along the satellite track, used to test three satellite-only decompositions

2025 to present, independent research

Reference NEXRAD dual-Doppler winds along the EarthCARE track VALIDATED ESA C-CD, JAXA CPR_CLP and DPR-based fall speeds

EarthCARE's cloud radar is the first Doppler radar in space. Its nadir beam measures air motion and hydrometeor fall speed together, and cannot separate them, and none of the three published satellite-only fall speed (ESA C-CD, JAXA CPR_CLP, DPR-PSD-assumed decomposition) had been tested against an independent measurement.

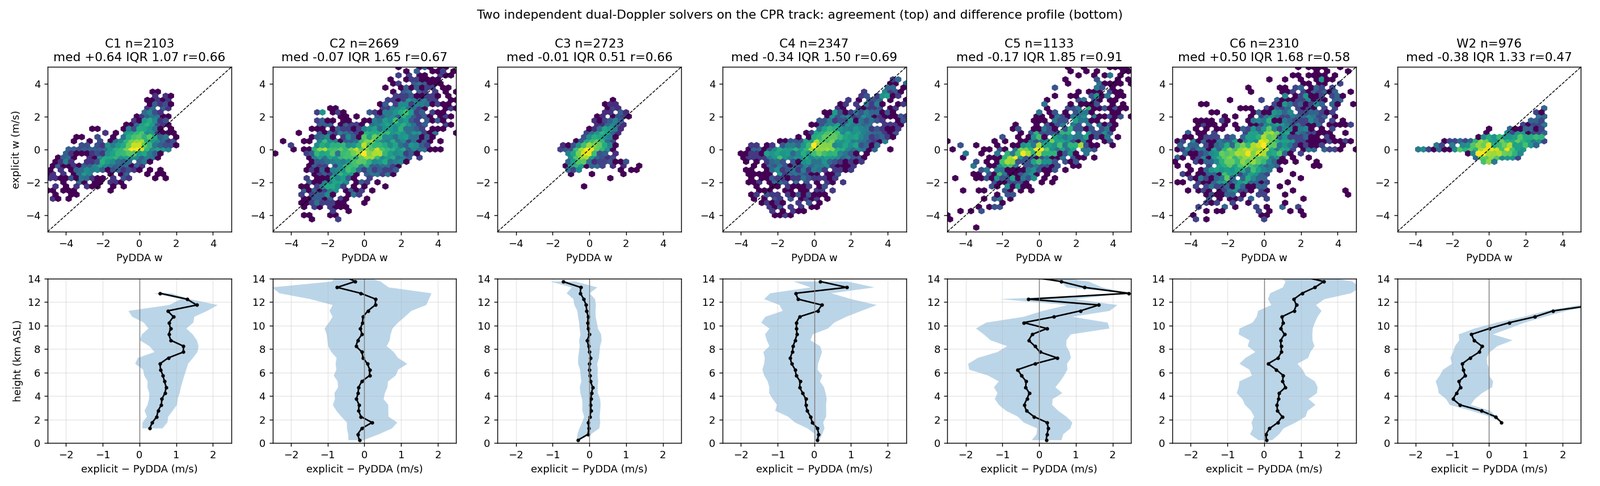
I built a ground-based dual-Doppler reference for vertical air motion along eight CPR tracks (PyDDA variational and explicit CEDRIC-type methods) from pairs of NEXRAD radars, cross-checked by two independent solvers: accurate to 0.65 m s⁻¹ in stratiform cloud and 1–2.3 m s⁻¹ in convection. And used it to evaluate the ESA C-CD, JAXA CPR_CLP and DPR-PSD-based fall-speed decompositions.

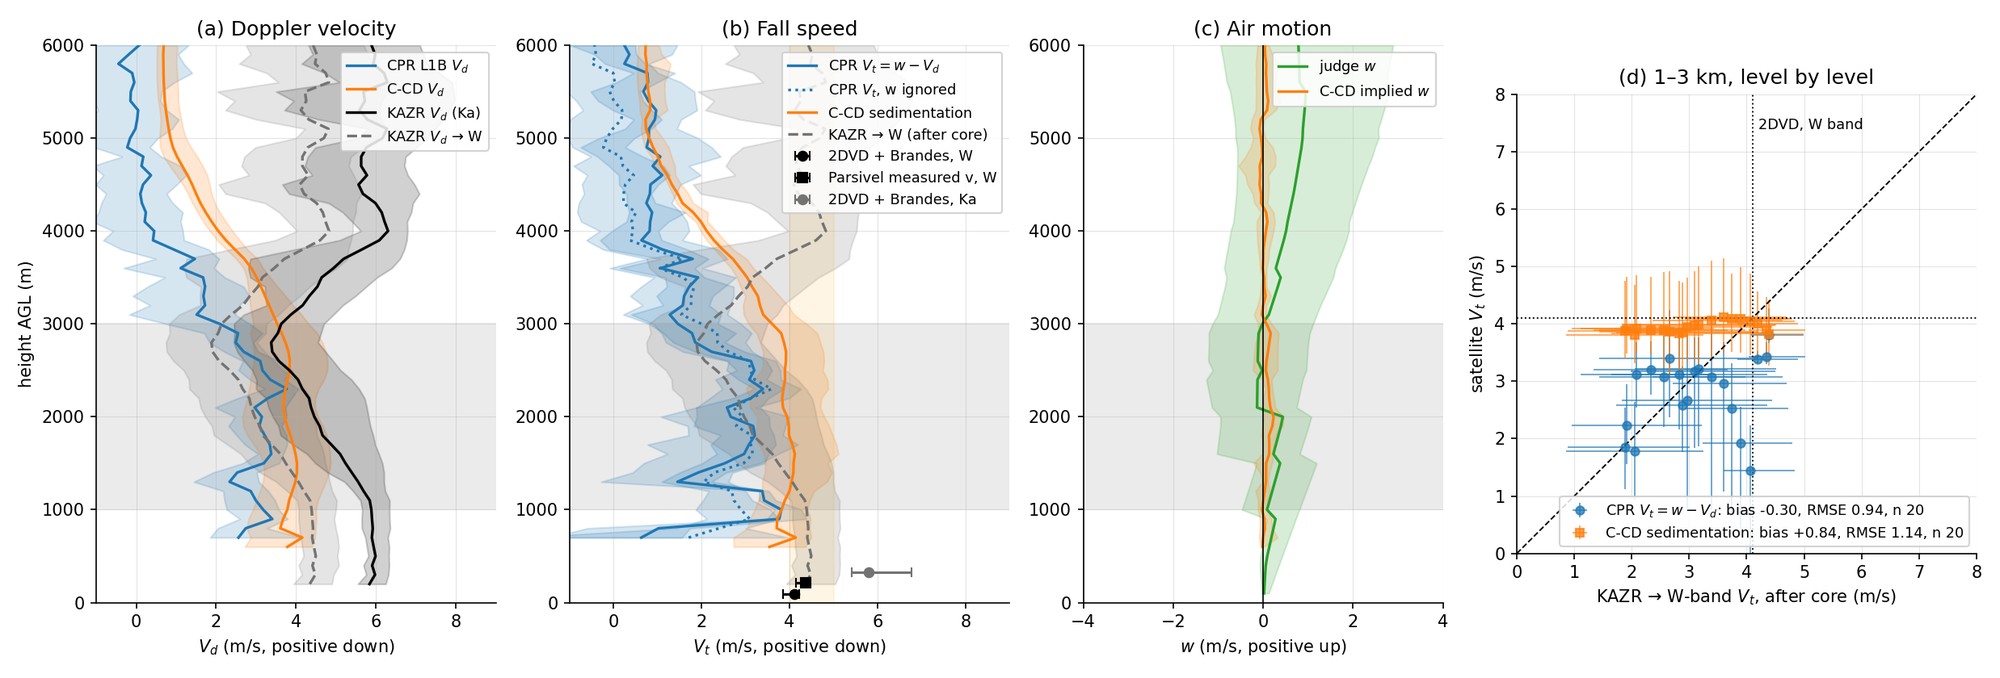
The ESA C-CD sedimentation velocity agrees with the reference-corrected fall speed to 0.45 m s⁻¹ where |w| < 0.5 m s⁻¹ and retains the air motion up to |w| ≈ 1.5 m s⁻¹. The JAXA CPR_CLP product assigns cloud-particle fall speeds 3 m s⁻¹ too small in rain and 0.5 m s⁻¹ in ice, so its air velocity is 1.1 m s⁻¹ too high and uncorrelated with the reference. The PSD-assumed decomposition is unbiased inside its stated snow range but biased by +0.7 to +2 m s⁻¹ above it and, on weaker evidence, by +3 to +4 m s⁻¹ in light rain at the DPR sensitivity floor. A disdrometer-derived W-band fall speed at the ARM Southern Great Plains site agrees with the C-CD sedimentation velocity to 0.3 m s⁻¹.

Li, H., 2026: Ground-based dual-Doppler validation of vertical air motion and hydrometeor fall speed in EarthCARE CPR Doppler observations. in preparation for Atmospheric Measurement Techniques.

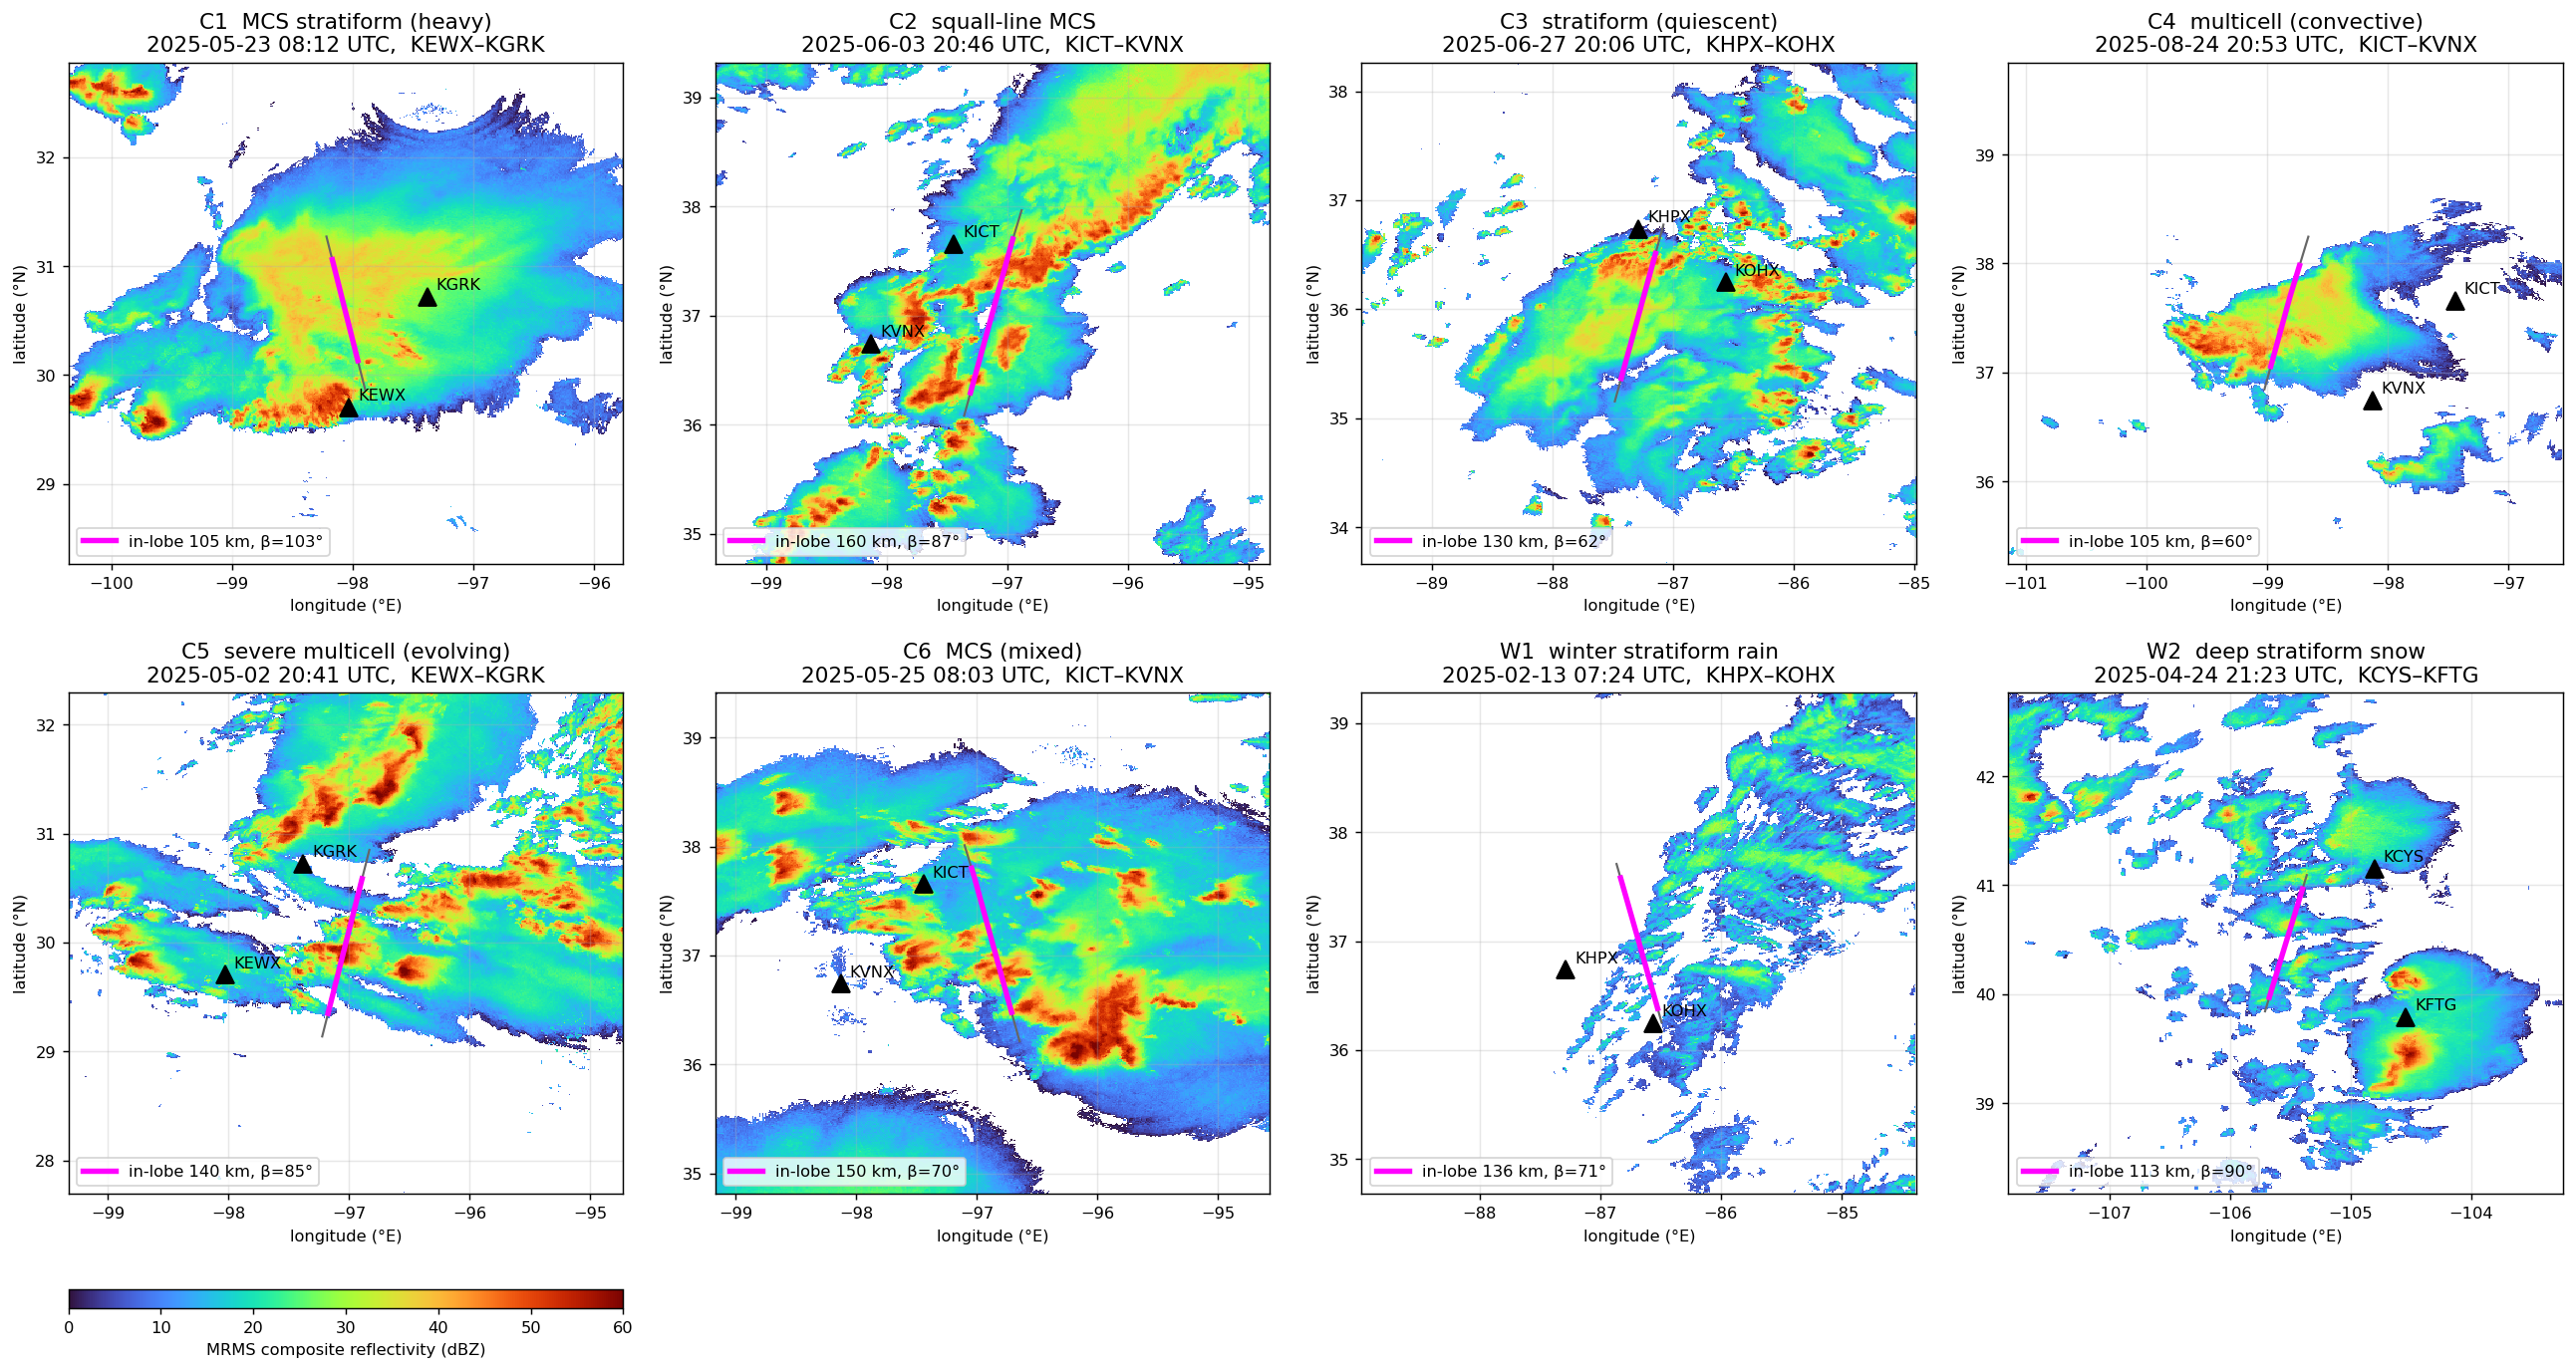
Eight maps of radar reflectivity with the EarthCARE track and the pair of NEXRAD radars marked for each case.
ESA C-CD sedimentation velocity against the dual-Doppler reference, eight cases pooled (64,811 bins). The air motion left inside the product grows almost one-for-one with the reference air motion up to ~1.5 m s⁻¹ and saturates near 1.8 m s⁻¹.
Eight maps of radar reflectivity with the EarthCARE track and the pair of NEXRAD radars marked for each case.
The eight cases: composite reflectivity at overpass time, the EarthCARE track segment and the NEXRAD pair used for the dual-Doppler retrieval.
Eight panels, one per case, comparing the dual-Doppler retrieved velocity profile with the EarthCARE CPR Doppler solution.
Two independent dual-Doppler solvers on the EarthCARE track, seven cases. Top: vertical air motion from the explicit solver against the variational (PyDDA) solver, with the 1:1 line; each title gives the number of bins, the median difference, the interquartile range (IQR) and the correlation. Bottom: the median difference by height, with its IQR shaded. The solvers agree to an IQR of 0.5 m s⁻¹ in quiescent stratiform cloud (C3) and 1.5–1.9 m s⁻¹ in convection.
Eight panels, one per case, comparing the dual-Doppler retrieved velocity profile with the EarthCARE CPR Doppler solution.
Validation at the ARM Southern Great Plains site (case C2): Doppler velocity, fall speed and air motion from EarthCARE and the ground cloud radar, with disdrometer fall speeds at the surface. In the 1–3 km layer the C-CD fall speed lies within 0.3 m s⁻¹ of the disdrometer value.

Marine warm-cloud drizzle life cycle

An EarthCARE Doppler view, validated at ARM ENA: generation → sub-cloud evaporation → surface fallout or virga

2025 to present, College Park, MD

Reference ARM ENA cloud radar, radiometer and 1,585 radiosondes Tested EarthCARE CPR overpasses

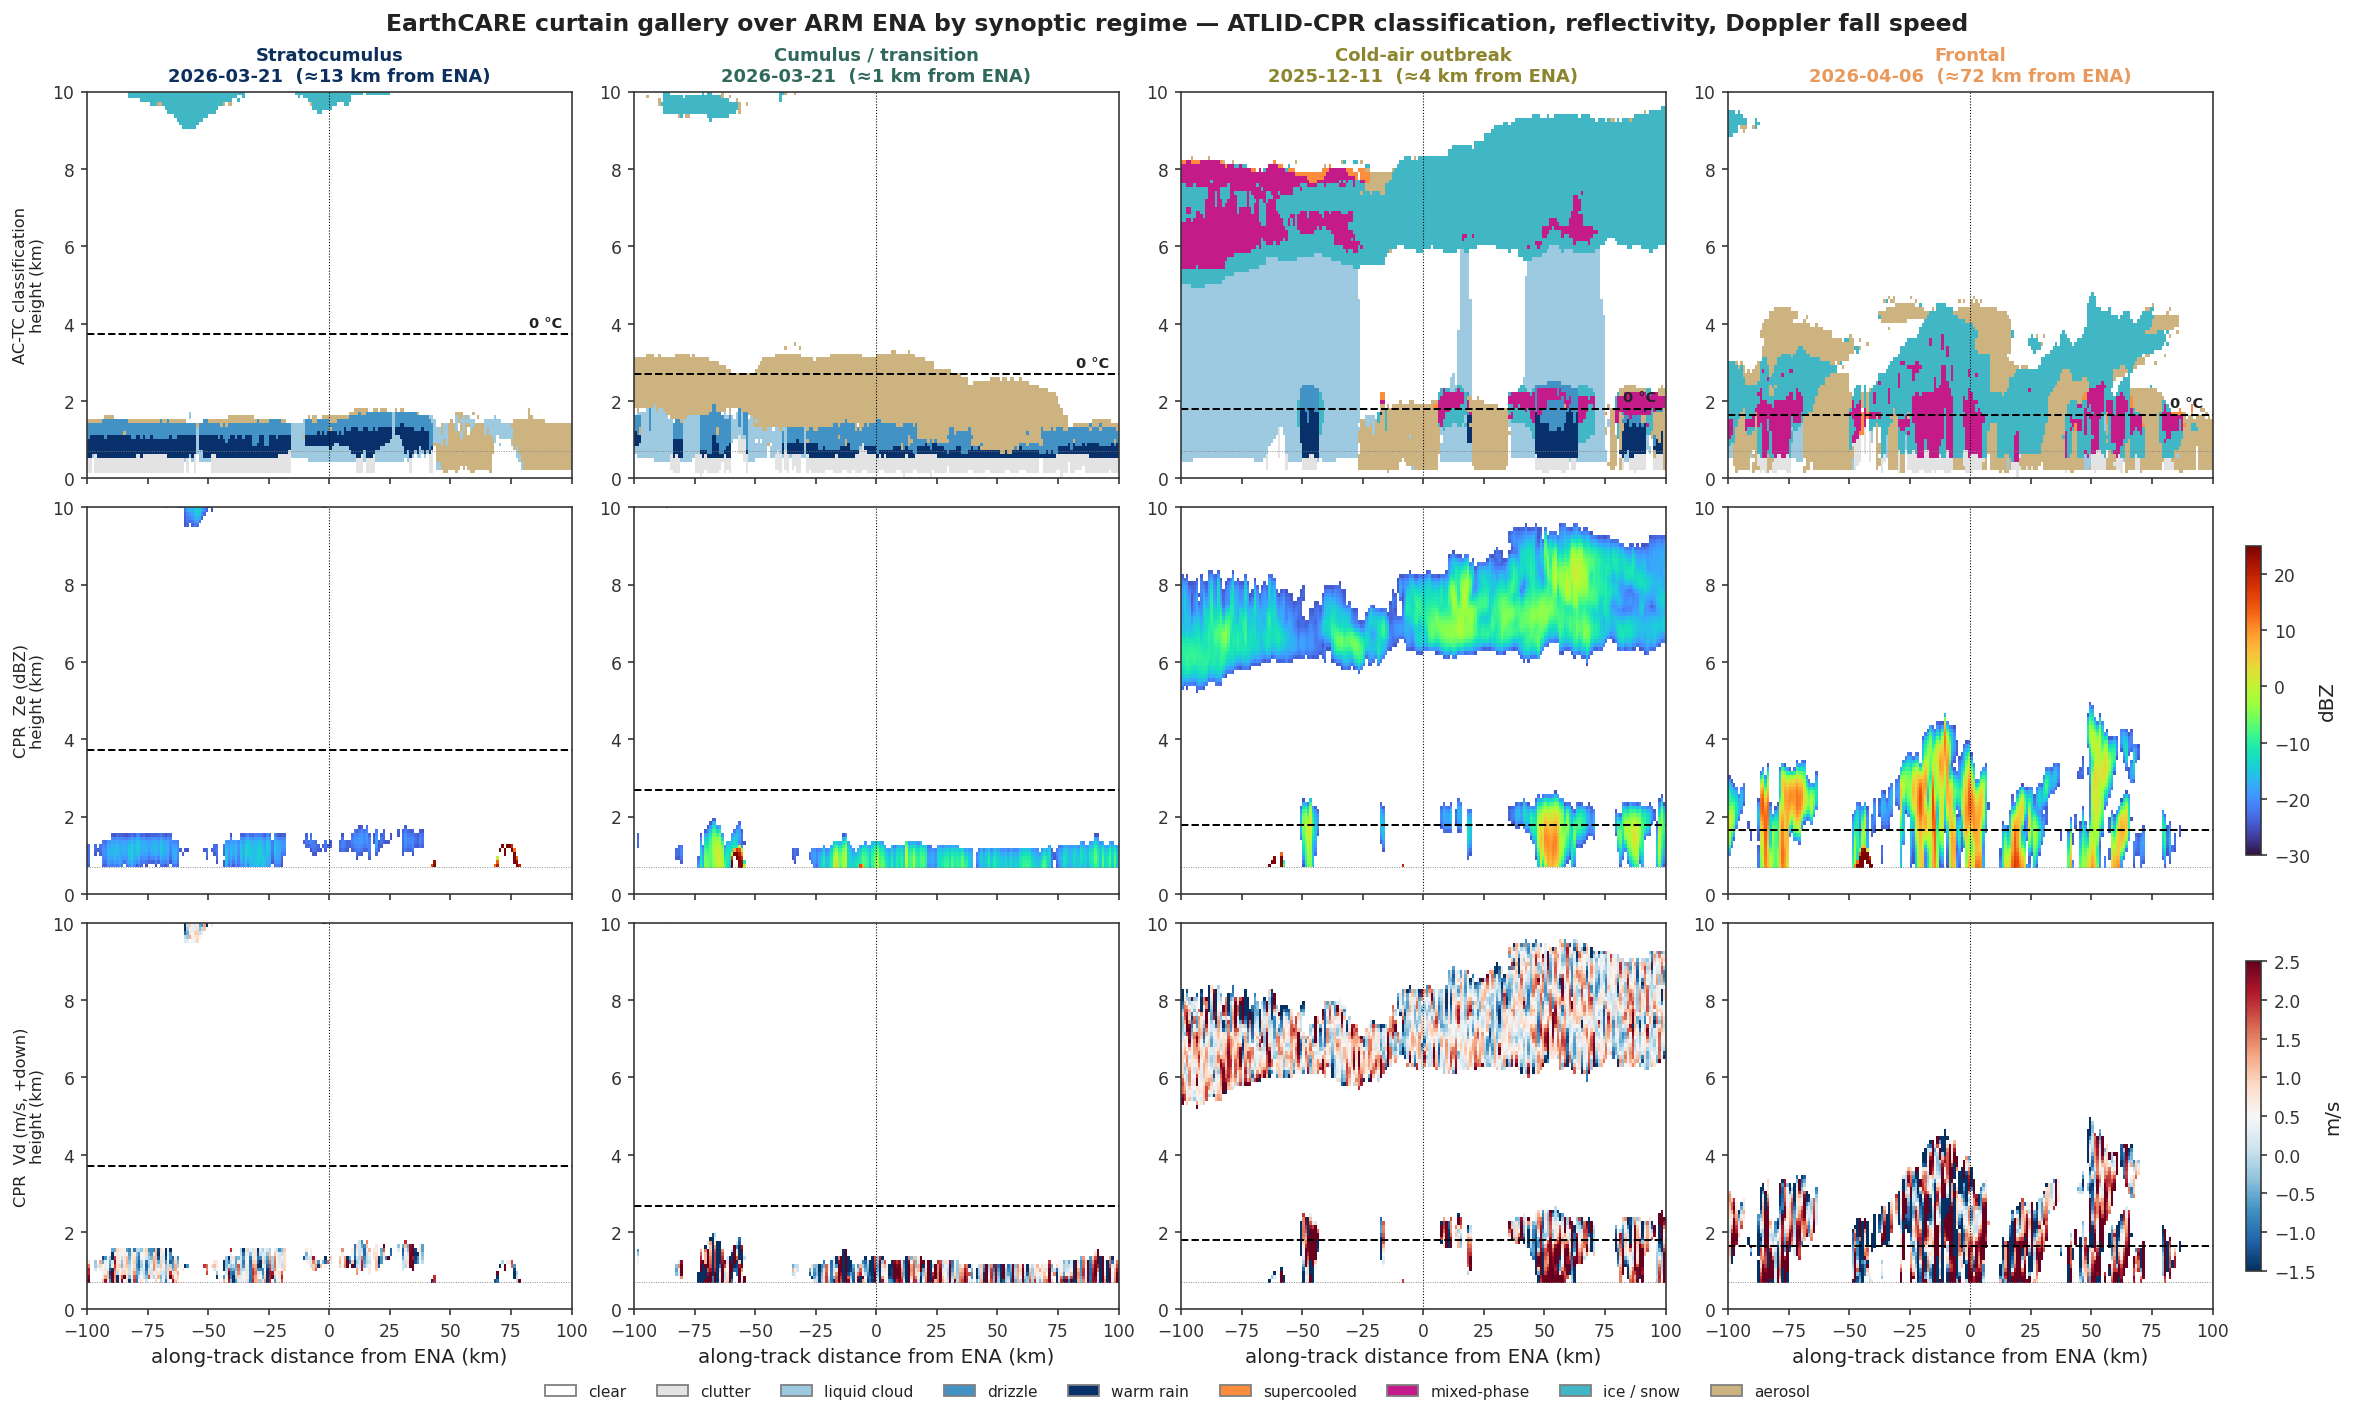
EarthCARE carries the first Doppler cloud radar in space, but it cannot see the lowest ~0.5 km above the sea, where most marine drizzle evaporates. With 201 overpasses of the ARM Eastern North Atlantic site (Dec 2024–May 2026), checked against the ground radar and 1,585 radiosondes, and sorted overpasses into four cloud regimes by an ω₅₀₀–cold-air-outbreak–EIS decision tree.

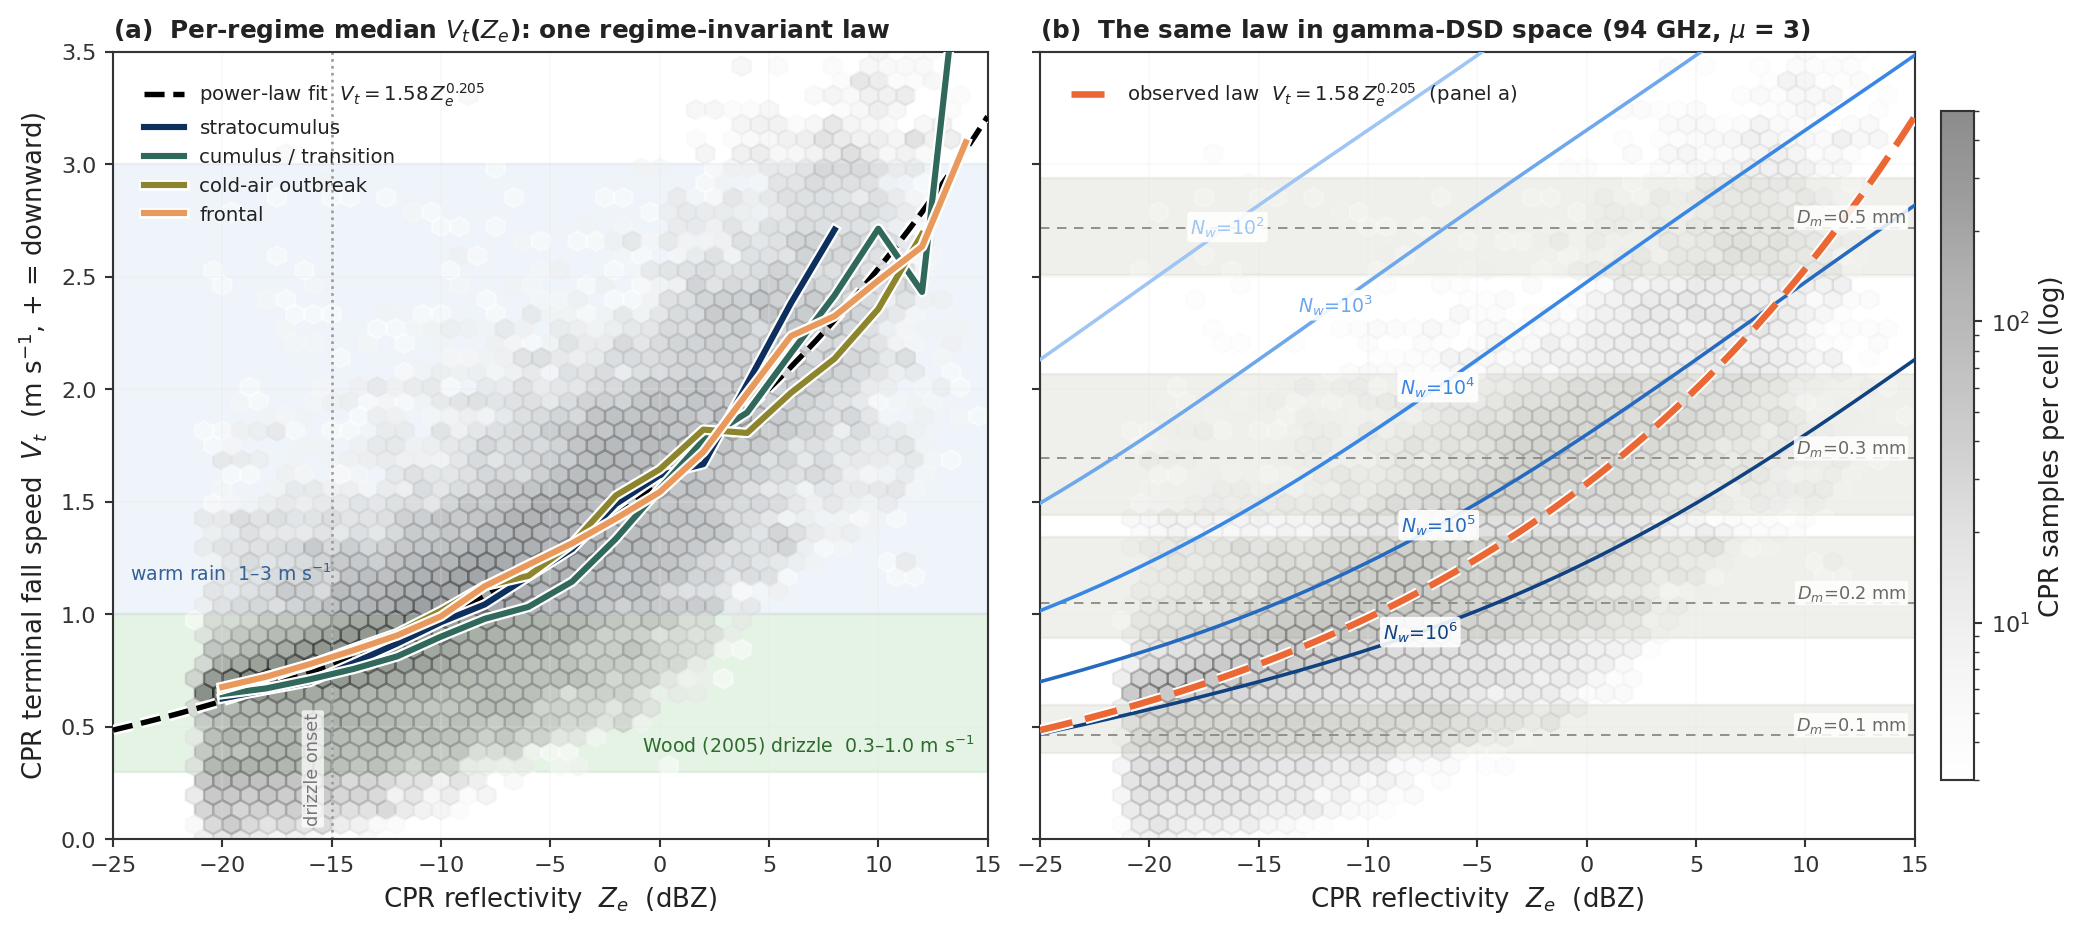
I show that the satellite and the ground site see different halves of the drizzle life cycle. Cloud-top height and liquid water path, both observable from orbit, control how much drizzle forms; cloud-base drop size and sub-cloud depth, visible only from the ground, decide whether it reaches the sea. Satellite-only drizzle climatologies therefore map where drizzle forms, not where it lands. In warm liquid cloud, EarthCARE's air-motion-corrected fall speeds from all four weather regimes collapse onto a single power law, Vt = 1.58 Ze0.205.

Drizzle generation turns out to be set by cloud-top height and LWP (β = 0.51, 0.34; R² = 0.38), both visible from space; its fate, mostly virga, by cloud-base drop size and sub-cloud depth below the CPR clutter floor, mostly evaporation before reaching the sea, is decided below the satellite's clutter floor, where only the ground site sees, so that satellite and ground site together close a drizzle life cycle neither observes alone.

First-author manuscript submitted to Atmospheric Chemistry and Physics.

Time-height plot of cloud radar reflectivity through a drizzling stratocumulus layer with cloud base and top marked.
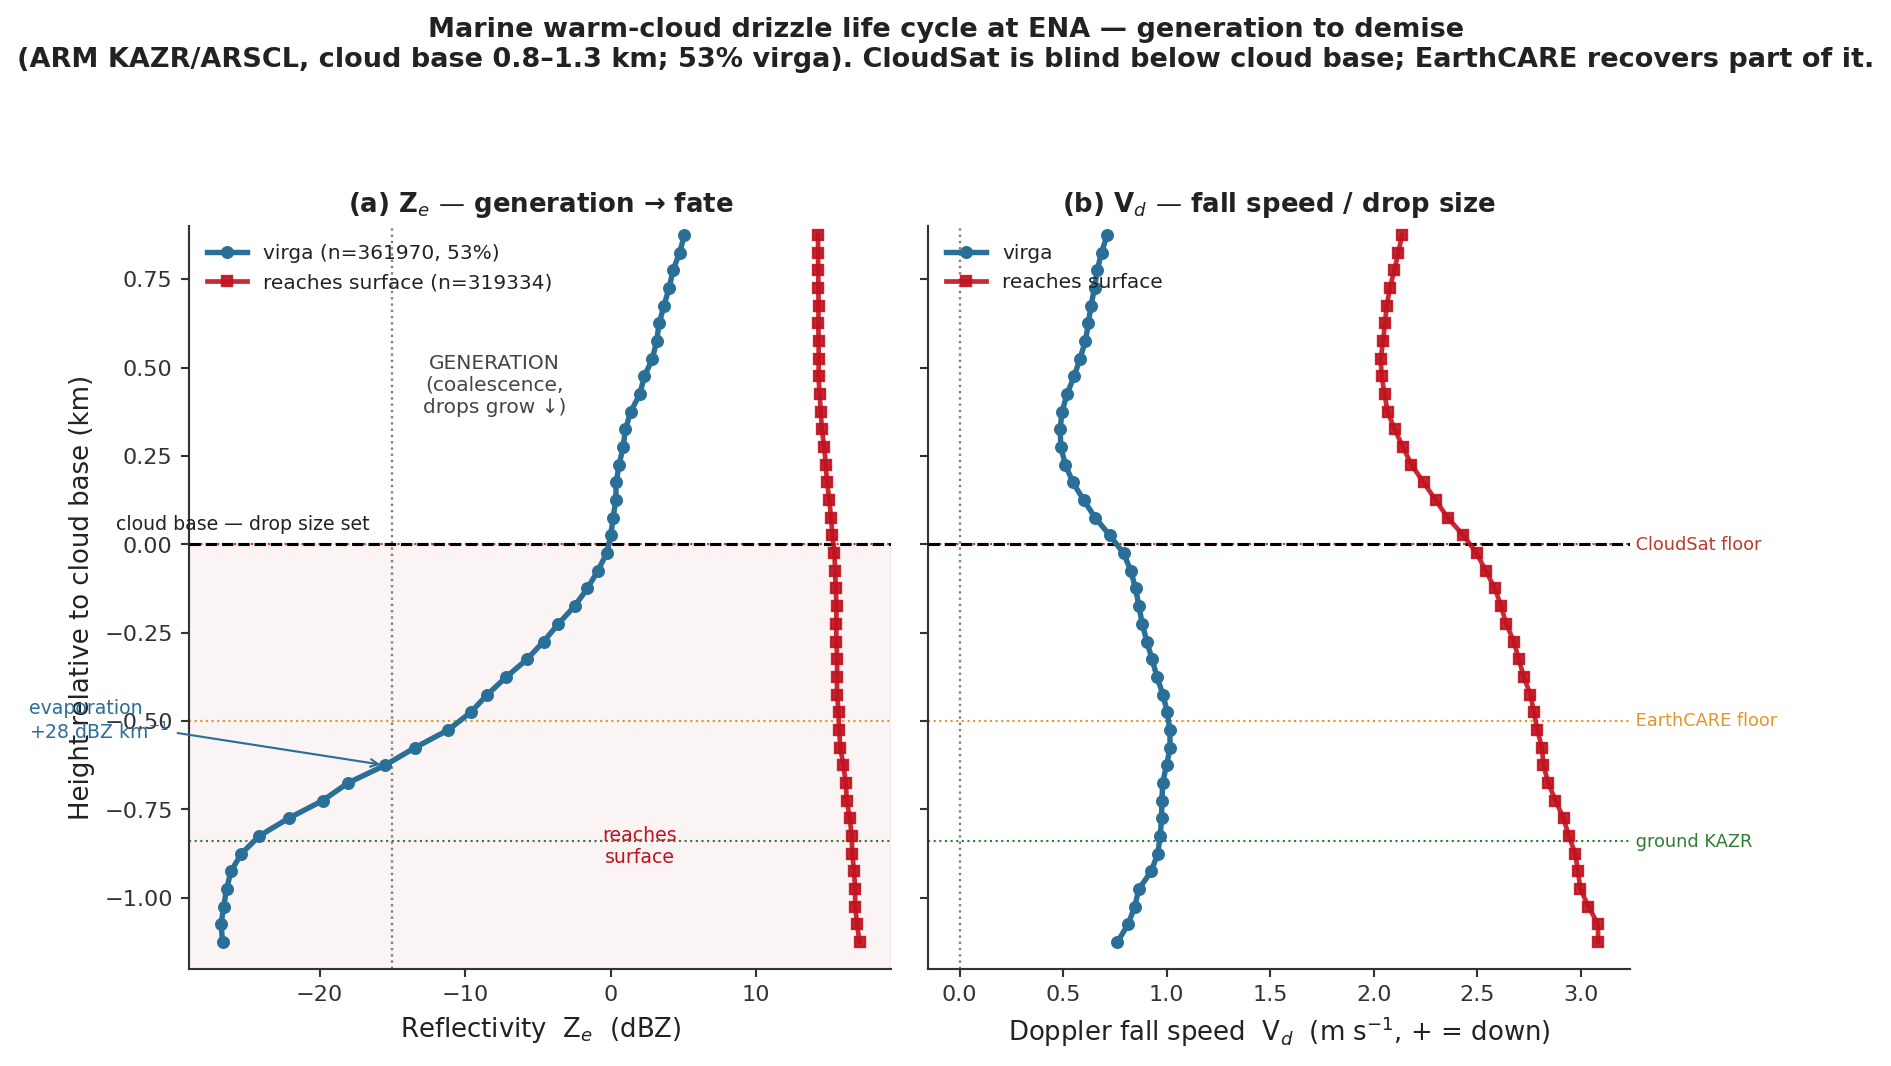
Drizzle below cloud base at the ARM site (~680,000 ground-radar profiles). Drizzle that reaches the surface leaves the cloud near +16 to +20 dBZ and falls almost unchanged; virga leaves near +1 dBZ and its echo collapses by ~28 dB per km as it evaporates. Lines mark the lowest level CloudSat, EarthCARE and the ground radar can see.
Map of EarthCARE ground tracks passing the ARM Eastern North Atlantic site on Graciosa Island.
EarthCARE terminal fall speed versus reflectivity in warm liquid, corrected for air motion and Mie effects. (a) The medians of all four regimes collapse onto one power law, V_t = 1.58 Z_e^0.205. (b) The same law in drop-size space, where it points to growth by collision–coalescence.
Map of EarthCARE ground tracks passing the ARM Eastern North Atlantic site on Graciosa Island.
One EarthCARE overpass per regime (stratocumulus, cumulus/transition, cold-air outbreak, frontal): ATLID–CPR target classification (top), radar reflectivity (middle) and Doppler velocity (bottom).

A drifting cloud radar: calibrating the ARM ENA Ka-band radar with ground disdrometers

2018 to 2023,Visiting Assistant Research Scientist, ESSIC, University of Maryland

DATAARM Calibrated Ka-band Radar

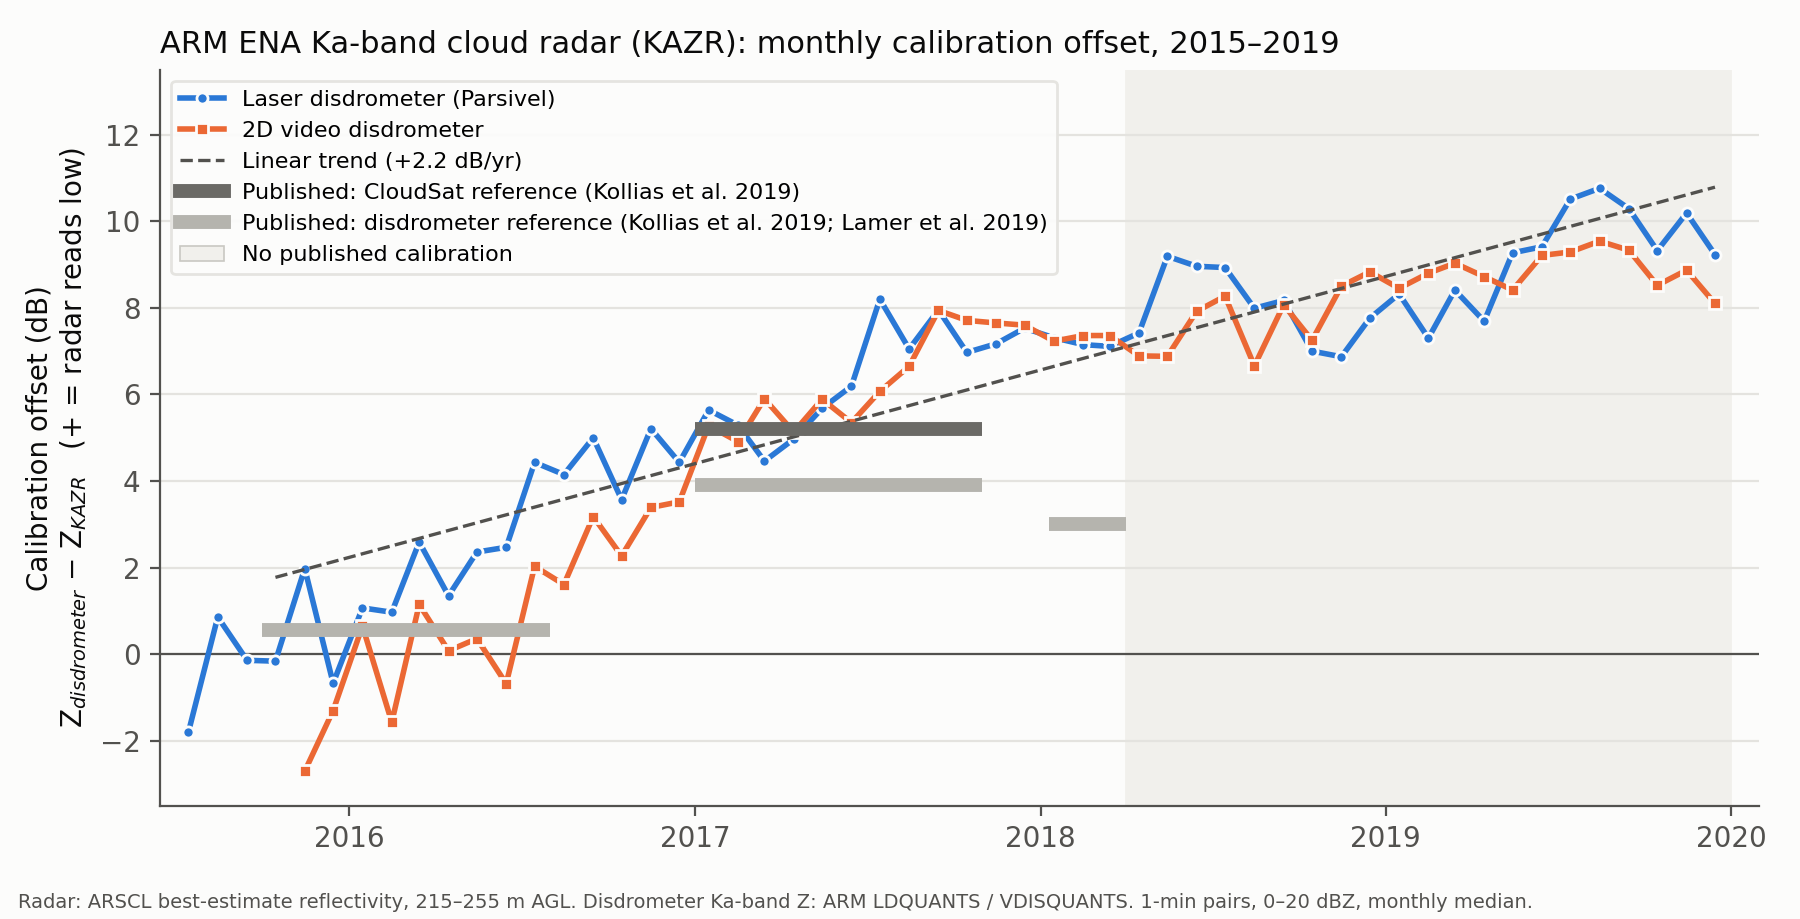
The ARM Eastern North Atlantic radar has recorded marine low clouds and drizzle since 2015, but its long-term reflectivity files are labeled "not yet calibrated." Before using the record for drizzle science, I checked how far off the radar is and whether the error changes. I compared the radar's reflectivity at ~240 m with the Ka-band reflectivity computed from raindrops counted by two independent surface disdrometers, using light rain (0–20 dBZ) over 1,629 days (~380,000 one-minute pairs).

The radar's reading drifted steadily low, by about 2 dB per year: near 0 dB in late 2015 and 9–10 dB low by the end of 2019. The two disdrometers agree month by month, so the drift is in the radar. The estimates reproduce the published calibrations of Kollias et al. (2019) to within 1–2 dB and cover April 2018 to December 2019, a period with no published calibration.

Scatter plots of calculated against observed brightness temperature for five SEVIRI infrared bands.
Monthly calibration offset of the ARM ENA Ka-band cloud radar (KAZR), July 2015 to December 2019, defined as Zdisdrometer − ZKAZR (positive values mean the radar reads too low). The radar reflectivity is the ARSCL best estimate at 215–255 m above ground. The reference is the Ka-band reflectivity computed from drop size distributions measured at the surface by a laser disdrometer (blue) and a 2-D video disdrometer (orange). Offsets are monthly medians of one-minute pairs in light rain (0–20 dBZ), from 1,629 days and about 380,000 pairs. Grey bars show published estimates for the same periods (Kollias et al. 2019; Lamer et al. 2019), and the shaded area marks April 2018 to December 2019, for which no calibration has been published. The dashed line is a linear fit (+2.2 dB yr⁻¹). The two independent disdrometers agree month by month, so the drift is in the radar: its reading fell by about 2 dB per year and was 9–10 dB too low by late 2019.

Warm-rain detection from CloudSat and VIIRS

2018 to 2023,Visiting Assistant Research Scientist, ESSIC, University of Maryland

DATACloudSat, VIIRSDetect Warm Rain

Warm rain dominates precipitation occurrence over the subtropical oceans but is largely missed by infrared and passive-microwave retrievals. I built a pipeline that collocates CloudSat radar with MODIS and VIIRS (~10⁵ rays matched within ±5 min)and tested whether retrieved cloud properties from visible and near-infrared imagery can detect warm rain.

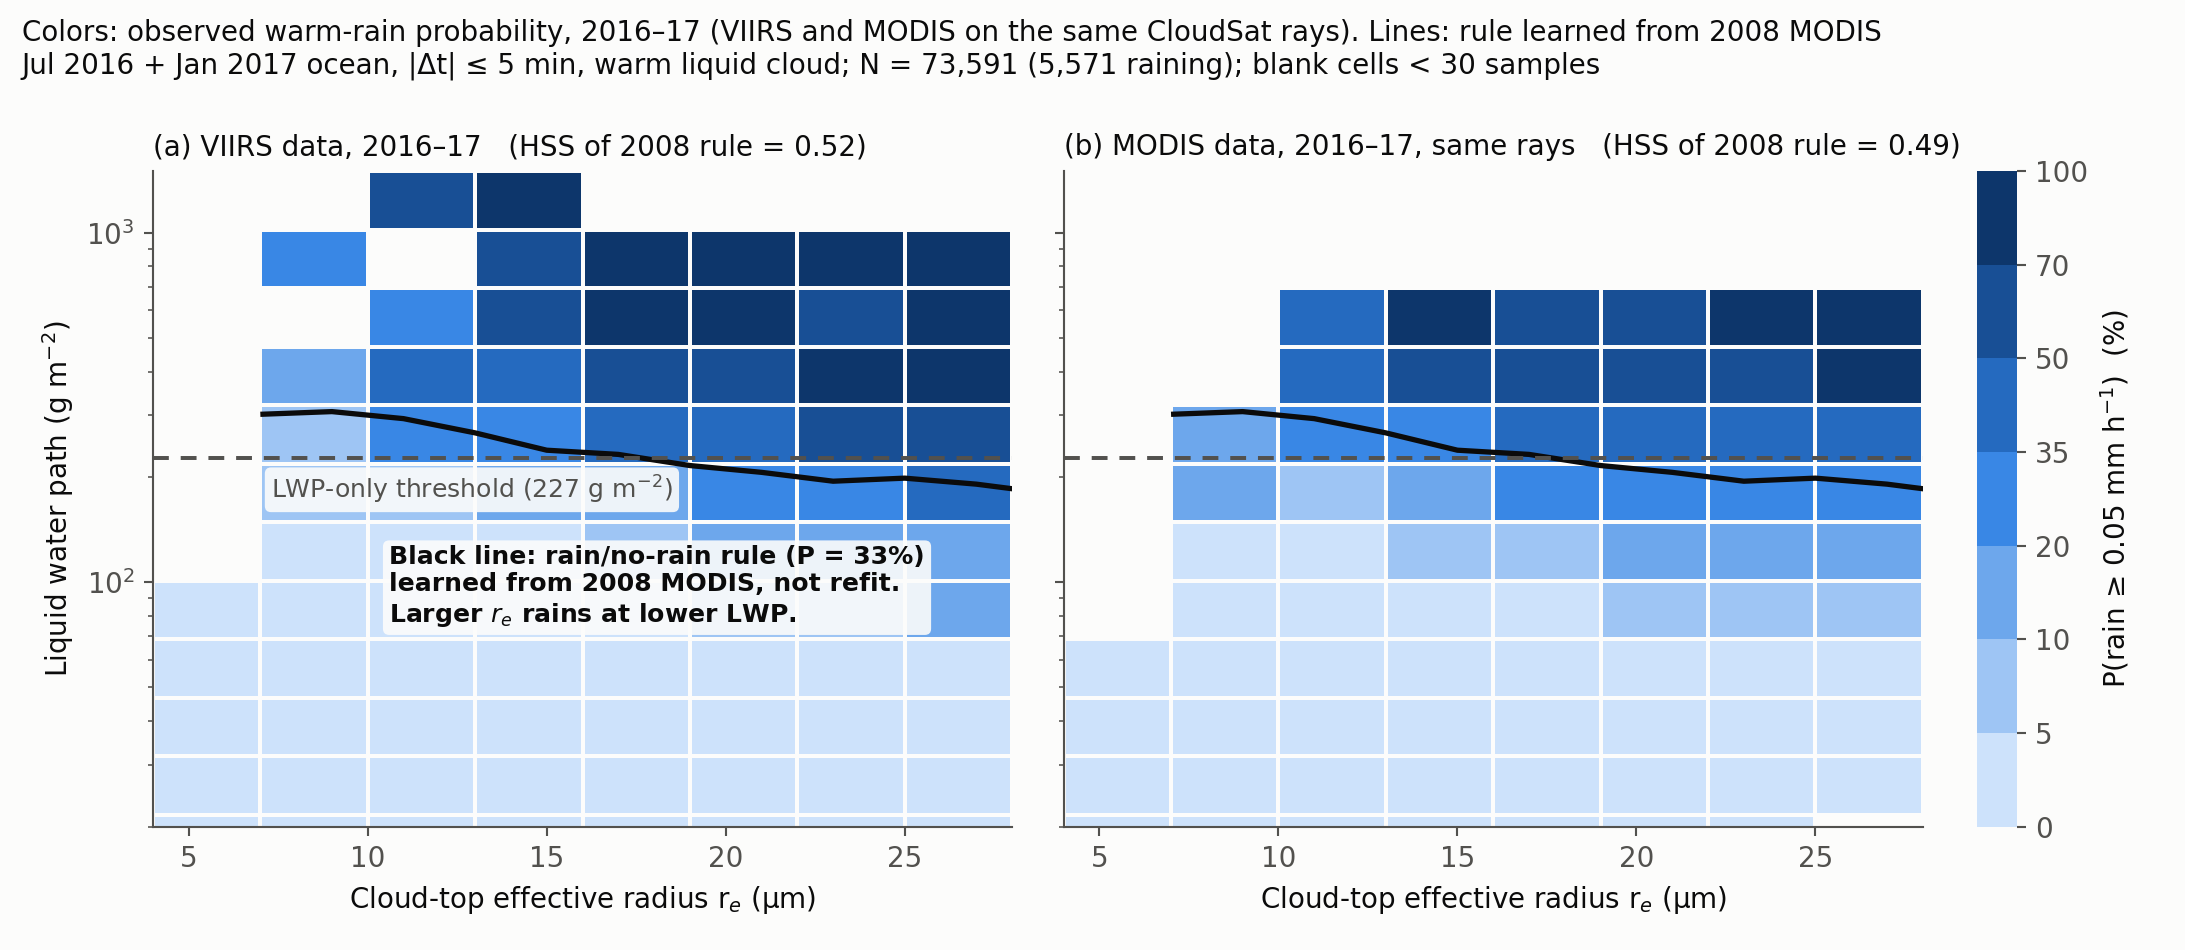
Revisiting Chen et al. (2011) with MODIS, I found liquid water path (LWP) to be the best single predictor of warm rain (HSS 0.61, threshold ≈ 0.22 mm), outperforming cloud-top temperature. Adding effective radius (re) helps further: at the same LWP, clouds with larger droplets rain more readily (Figure).

I then tested whether this approach carries over to VIIRS. A rain/no-rain rule in LWP–re space learned from 2008 MODIS transfers to 2016–17 VIIRS without refitting: HSS 0.52, compared with 0.49 for MODIS on the same collocated rays. Applied pixel by pixel, the rule produces full-swath VIIRS warm-rain maps, extending CloudSat's narrow curtain to the full imager swath.

Time-height plot of cloud radar reflectivity through a drizzling stratocumulus layer with cloud base and top marked.
Probability of warm rain as a function of cloud-top effective radius and liquid water path, observed by (a) VIIRS and (b) MODIS on the same CloudSat-collocated rays (ocean, July 2016 and January 2017, |Δt| ≤ 5 min, warm liquid clouds; N = 73,591, of which 5,571 raining; rain ≥ 0.05 mm h⁻¹). Colors show the rain probability observed in 2016–17. The solid line is a rain/no-rain rule (P = 33%) learned from MODIS and applied to VIIRS without refitting; the dashed line is the LWP-only threshold (227 g m⁻²). Both sensors show that, at fixed LWP, clouds with larger droplets rain more readily. Blank cells contain fewer than 30 samples.

Retrieval of atmospheric water vapor from SEVIRI infrared

2017, Visiting Scholar, CIMSS, University of Wisconsin–Madison

Retrieval Atmospheric Water Vapor Radiative Transfer PFAAST

I contributed to adapting the GOES Sounder atmospheric profile algorithm to the SEVIRI imager to retrieve atmospheric water vapor: a regression trained on a database of atmospheric profiles, then a physical retrieval with the PFAAST radiative transfer model.

Modeled and observed brightness temperatures differ slightly, so the work included a bias correction for five infrared bands derived from matched profiles, the same matchup analysis that underlies radiometer intercalibration.

Scatter plots of calculated against observed brightness temperature for five SEVIRI infrared bands.
The comparison between the calculated and observed brightness temperatures at five IR bands for bias correction. In each panel the solid line represents the linear fitting and the dash line is the 1-to-1 line

Error structure of satellite precipitation over Tibetan Plateau in Winter

2015 to 2016, Postdoctoral Fellow, Institute of Geographic Sciences and Natural Resources Research, Chinese Academy of Sciences; revisited in 2026 with the current product versions

PI Grant NSFCTested IMERG, TMPA, CMORPH and GSMaP Case the snow-covered winter Plateau

PI Grant China Postdoctoral Science Foundation Merged Radar-satellite-gauge precipitation

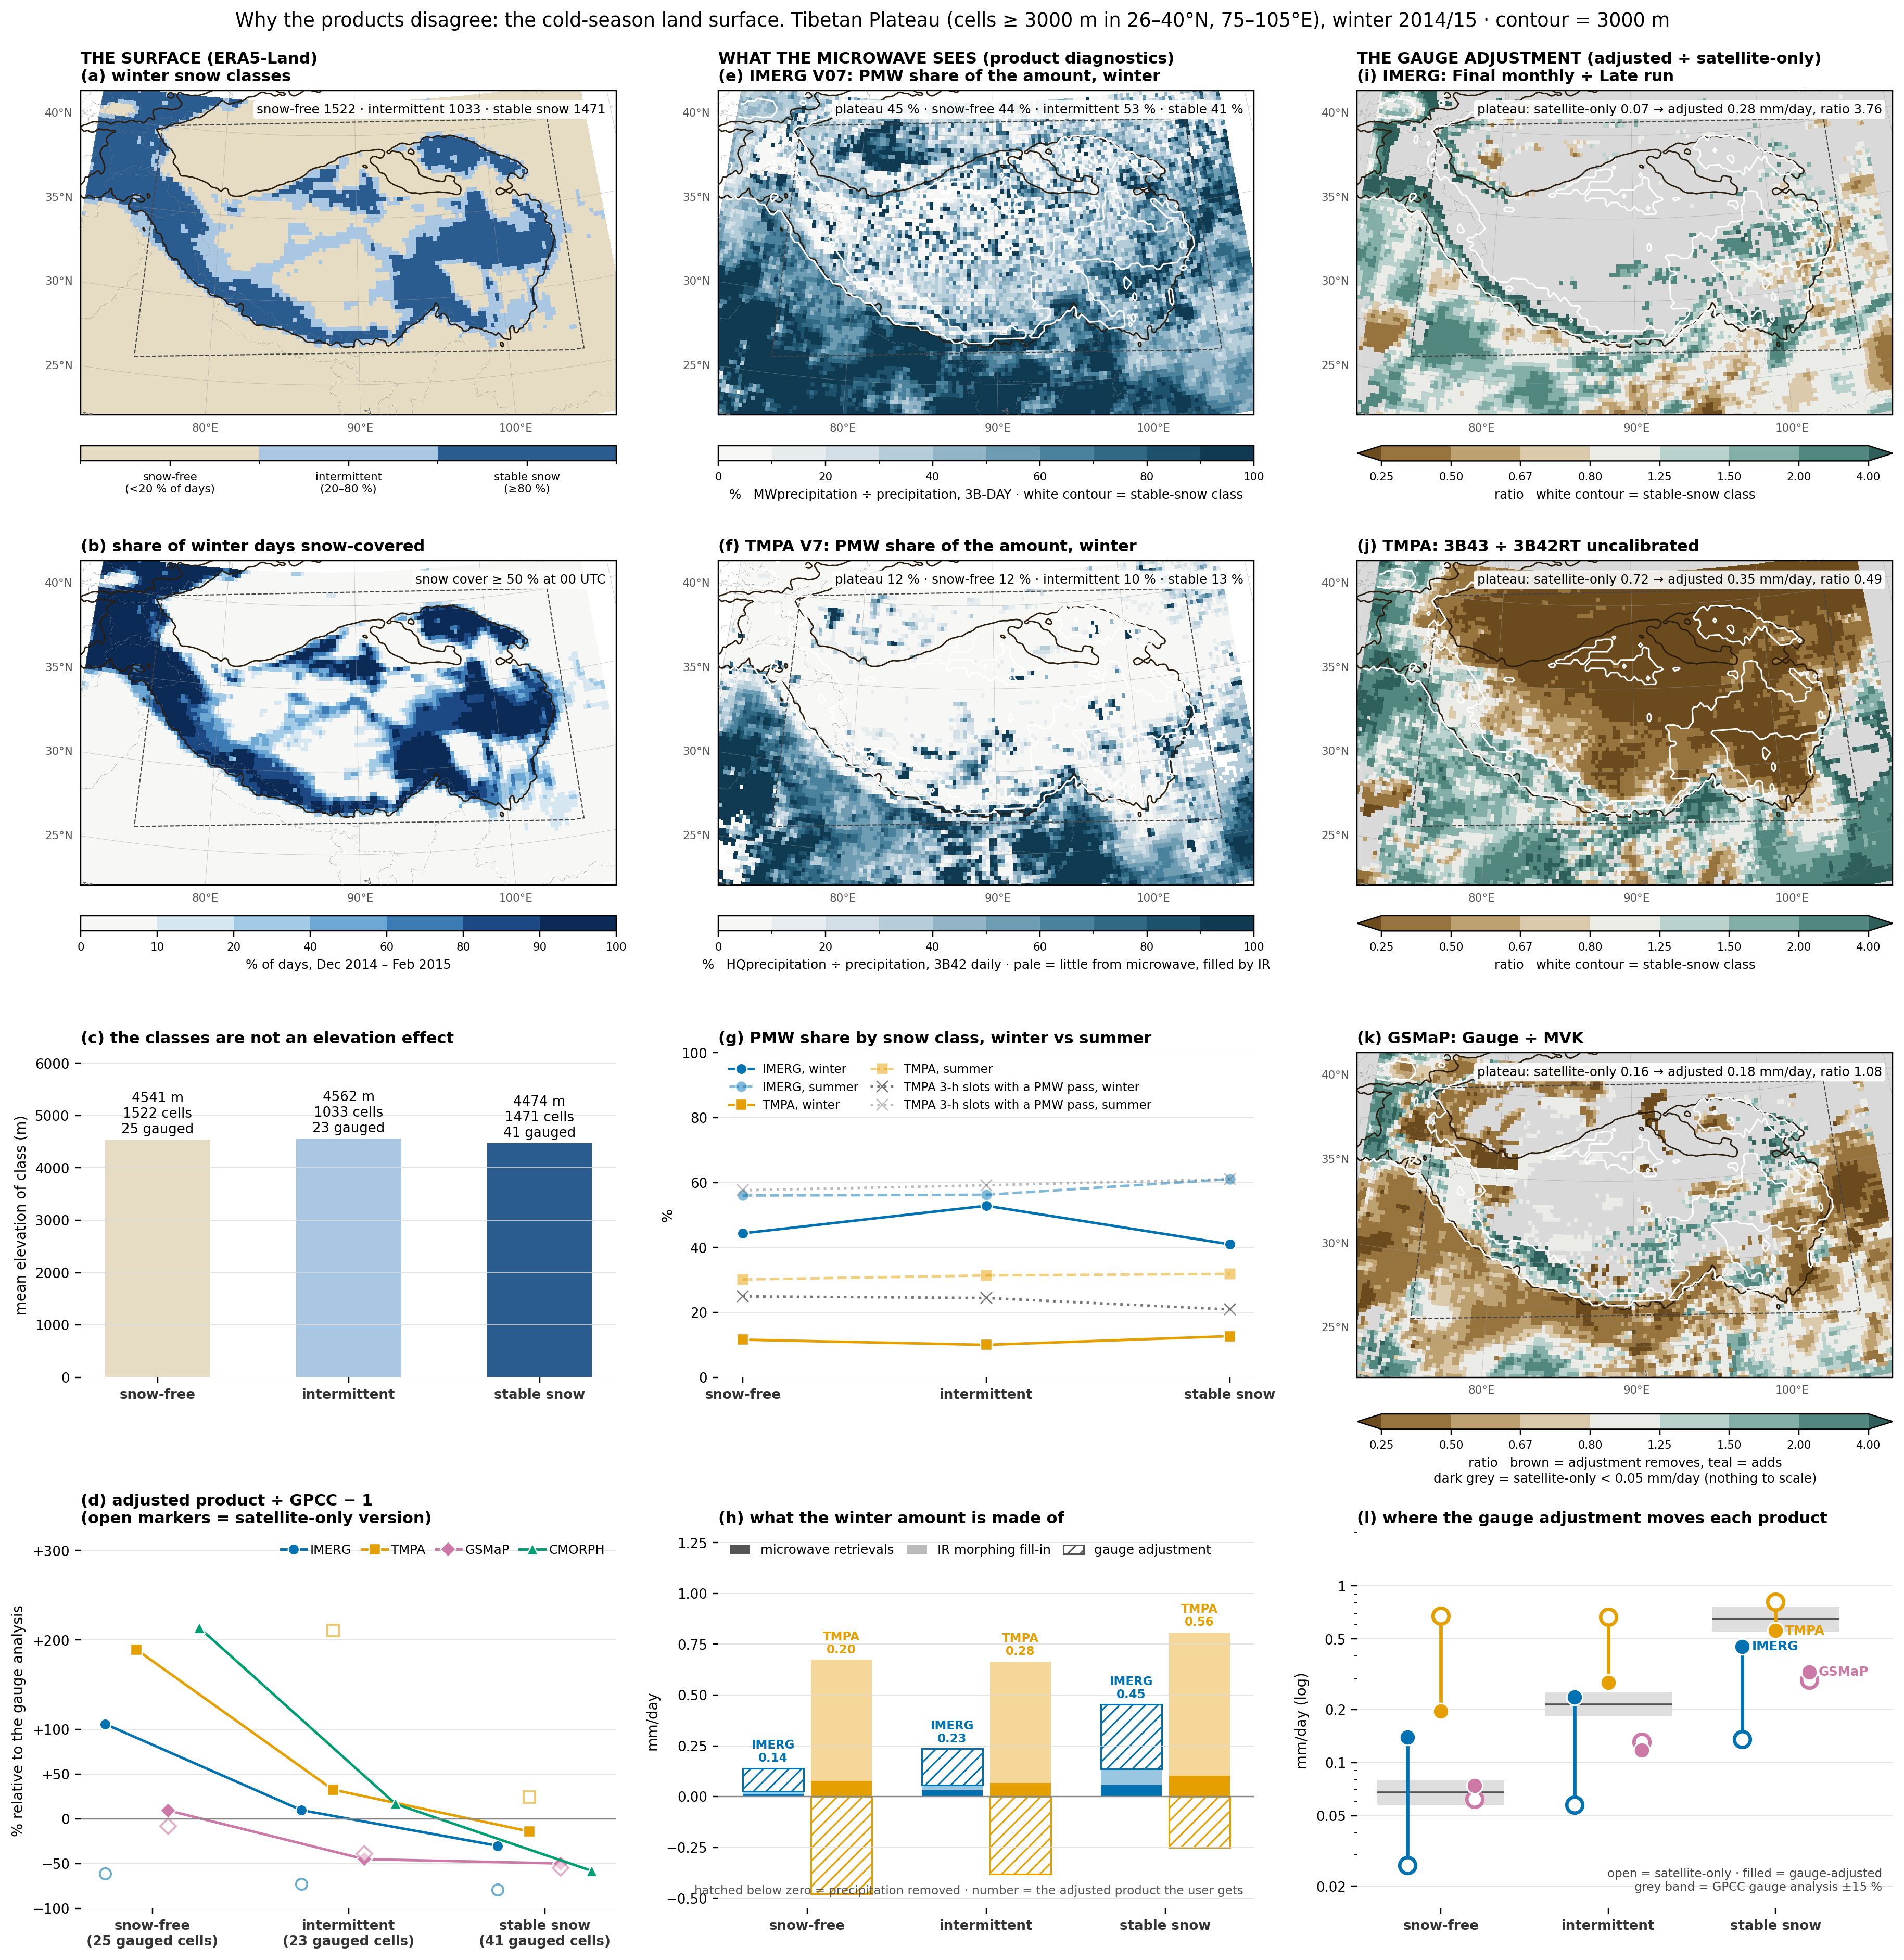
The Tibetan Plateau in winter is a snow-covered, gauge-sparse surface where the retrievals are known to struggle. Four gauge-adjusted products (IMERG V07 Final, TMPA 3B43, CMORPH CDR, GSMaP Gauge) are put on one 0.25° grid and compared with their multi-product mean, GPCC gauges, PERSIANN-CDR(infrared-only)and their own satellite-only versions. Cells above 3000 m are split by ERA5-Land snow cover into snow-free, intermittent and stable-snow classes that sit at the same mean elevation, so any difference between classes is a surface effect.

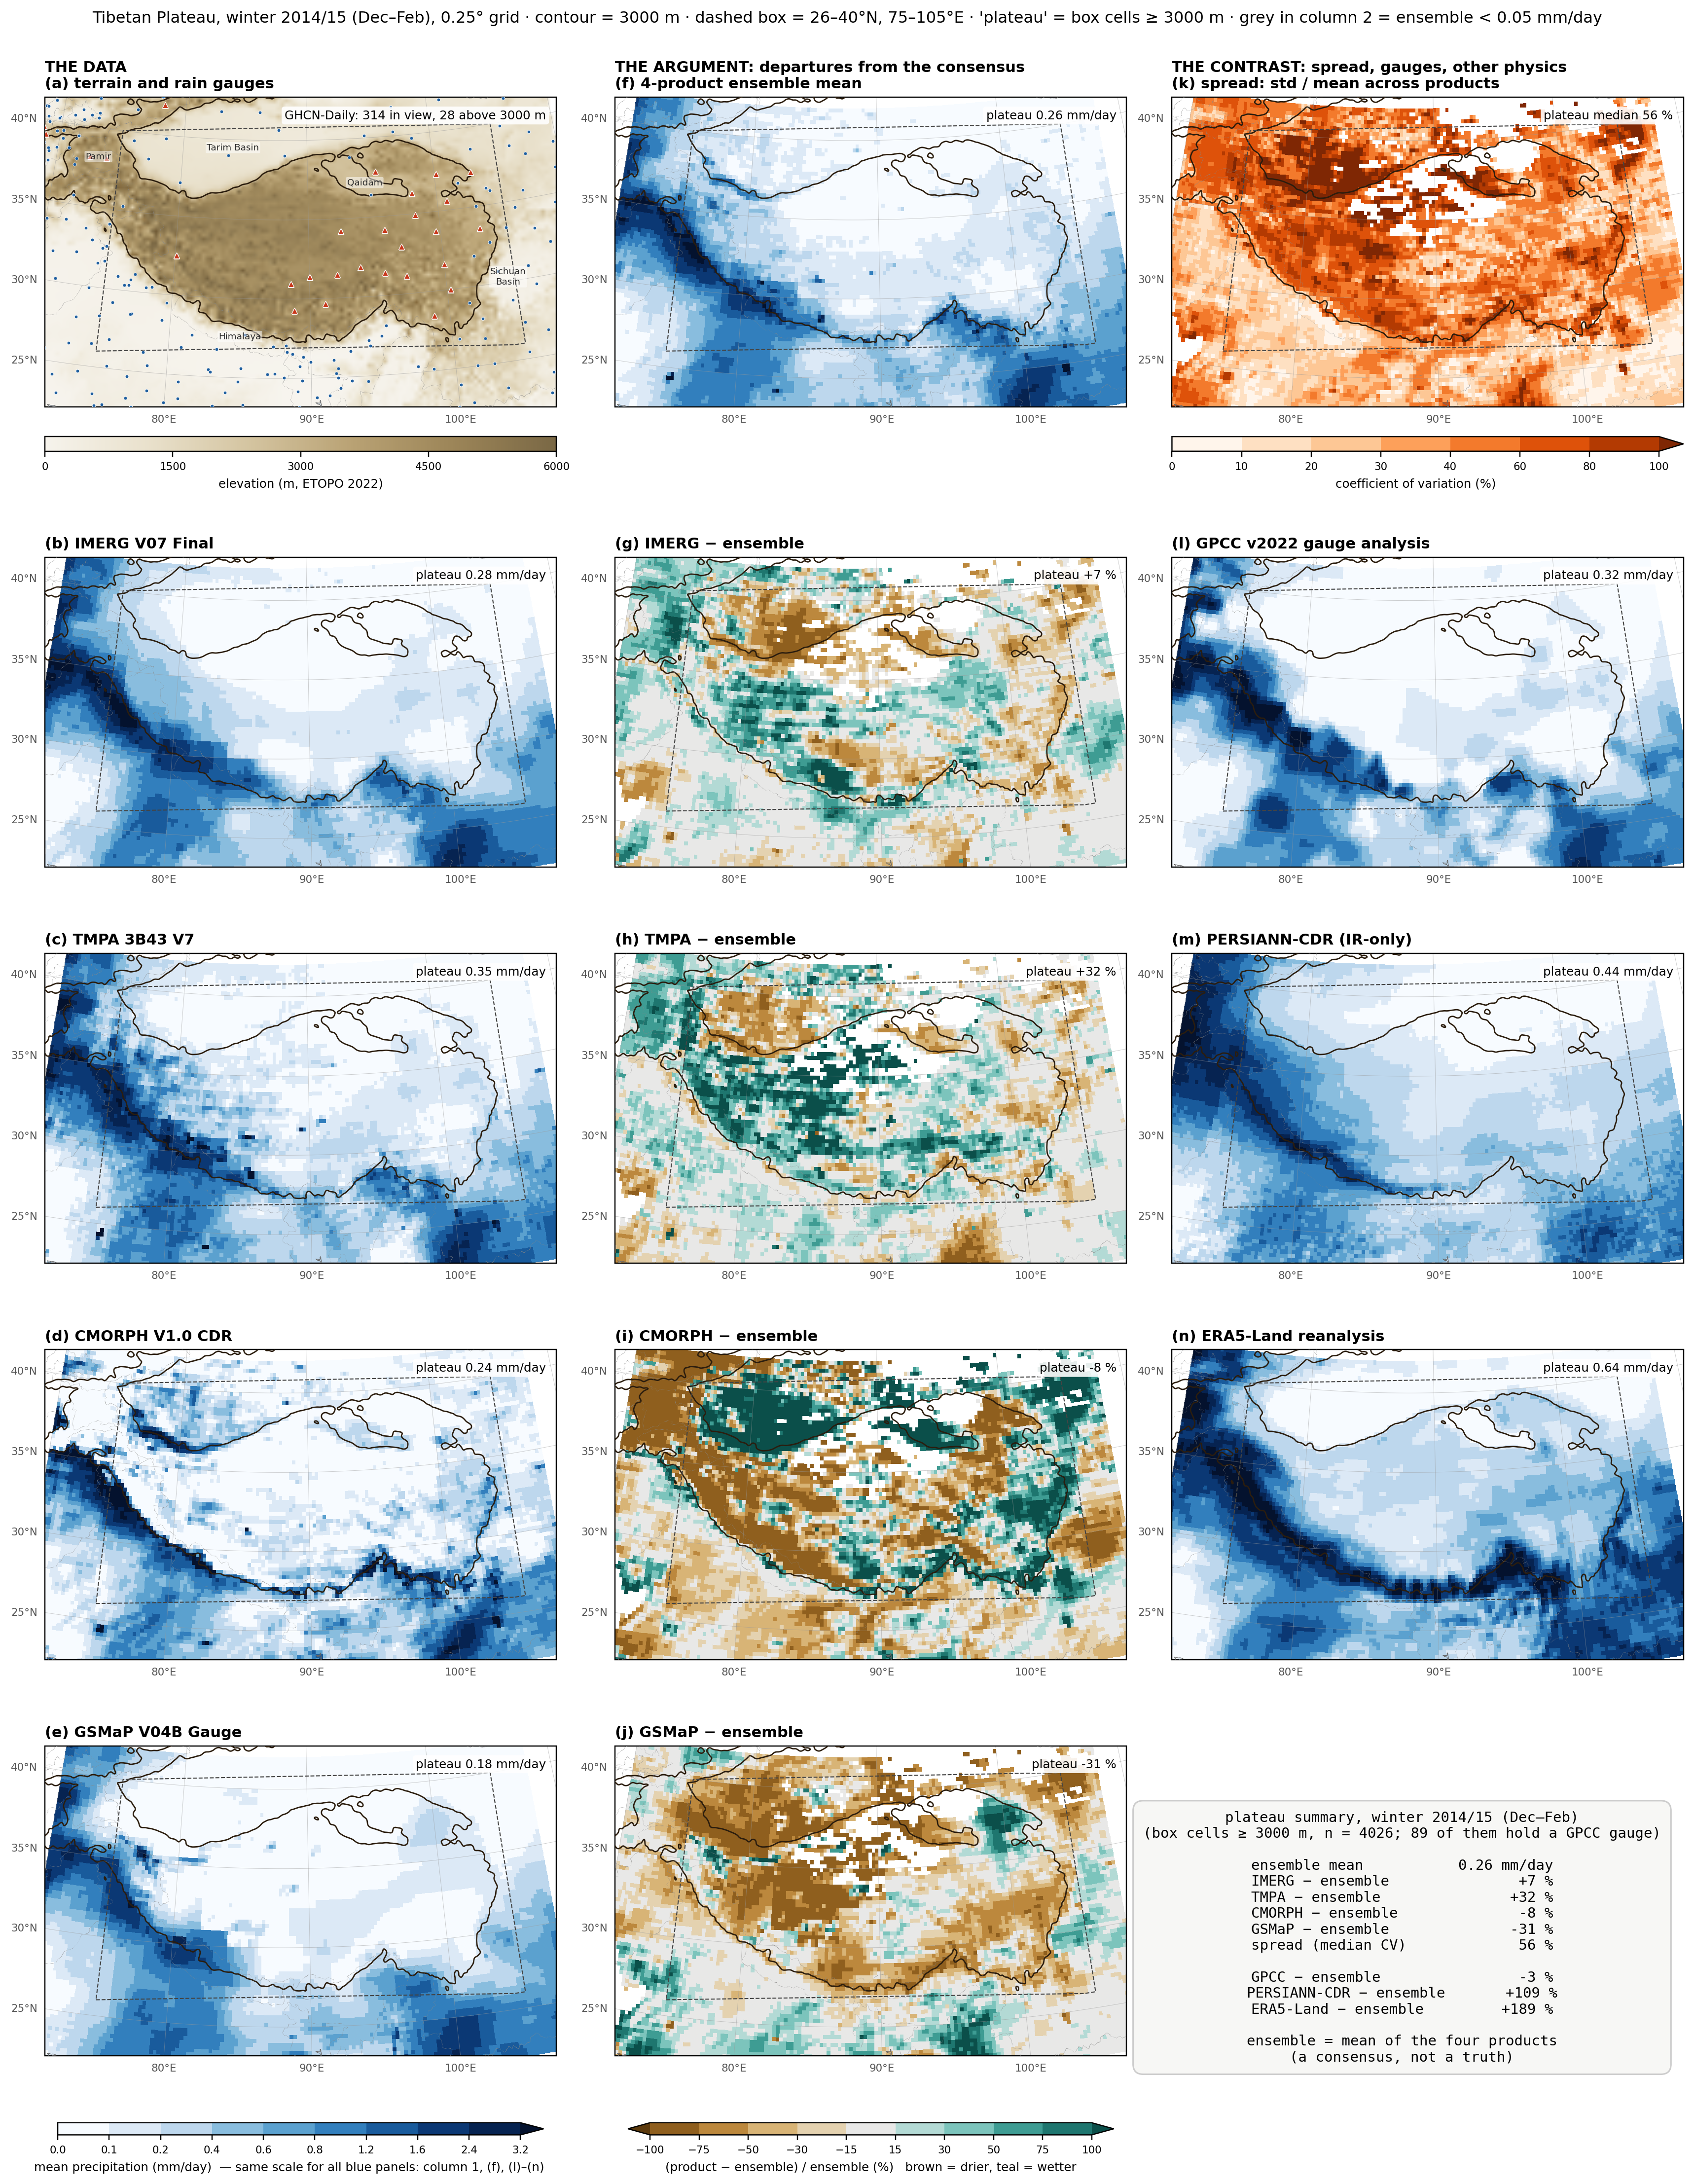
Over the winter Plateau (cells above 3000 m, December 2014 to February 2015) the four products lie between 31 % below and 32 % above their common mean, with a median spread of 56 % against 26 % in summer. Each departs for a different reason. IMERG sees almost nothing (0.07 mm/day, 1 % wet days) and the gauge ratio multiplies it by 3.8: the Plateau value is GPCC's. TMPA TMPA sees too much: only 12 % of its amount is microwave, the rest is infrared over cold ground; the gauges halve it and it is still 32 % high. CMORPH is the most surface-sensitive, +13 % over bare ground and −27 % over stable snow, as microwave screening over snow propagates through the morphing. GSMaP is the driest (−31 %) and effectively unadjusted, its gauge calibration acting weakly where gauges are sparse.

What this means for retrieval. The gauge adjustment equalizes the products' totals but not their errors: at constant elevation all four still over-report on cold bare ground and under-report on snow. What the retrievals lose is the microwave signal, screened or down-weighted where frozen ground and snow look like precipitation to the radiometer, and infrared morphing cannot put it back. Improving winter precipitation over land therefore has to happen inside the retrieval, with a surface-dependent prior, the high-frequency channels, and reanalysis temperature and snow depth as ancillary inputs, rather than in the adjustment afterwards.

Data: IMERG V07B, TMPA 3B43/3B42/3B42RT V7 (NASA GES DISC); CMORPH V1.0 CDR, PERSIANN-CDR, ETOPO 2022 and GHCN-Daily (NOAA NCEI); GSMaP V04B (JAXA); GPCC Full Data Monthly v2022 (DWD); ERA5-Land(Copernicus CDS).

Fifteen maps in three columns for winter 2014/15: the four satellite products, their departures from the ensemble mean, and the spread and three references.
Winter 2014/15 (December 2014 to February 2015). Left: Tibetan Plateau terrain, gauges and the four products. Middle: the four-product mean and each product's departure from it (brown drier, teal wetter). Right: spread across products, GPCC, infrared-only PERSIANN-CDR, ERA5-Land.
Twelve panels in three columns: snow-cover classes, passive-microwave share of the IMERG and TMPA amounts, gauge-adjustment ratios, and summaries by snow class.
Why they disagree. Left: Cells above 3000 m split by ERA5-Land snow cover into snow-free, intermittent and stable-snow, all at the same mean elevation. Middle: its own microwave retrievals supplied, winter against summer, for the two products (IMERG V07 and TMPA). Right: gauge-adjusted ÷ satellite-only for each product. A ratio far from 1 means the value users get comes from the gauges, not the satellite; grey where the satellite-only value is too small to scale.

Bottom row, by snow class: departures from the gauge analysis; the winter amount split into microwave, infrared fill-in and gauge adjustment; and where the adjustment moves each product, from satellite-only (open circle) to gauge-adjusted (filled circle), with the GPCC analysis as a grey band.

Variational merging of hourly satellite precipitation and rain gauge over China

2010 to 2014, Ph.D. Institute of Remote Sensing Applications, Chinese Academy of Sciences

2012 to 2013, Exchage scholarship. Naional Weather Center, University of Oklahoma

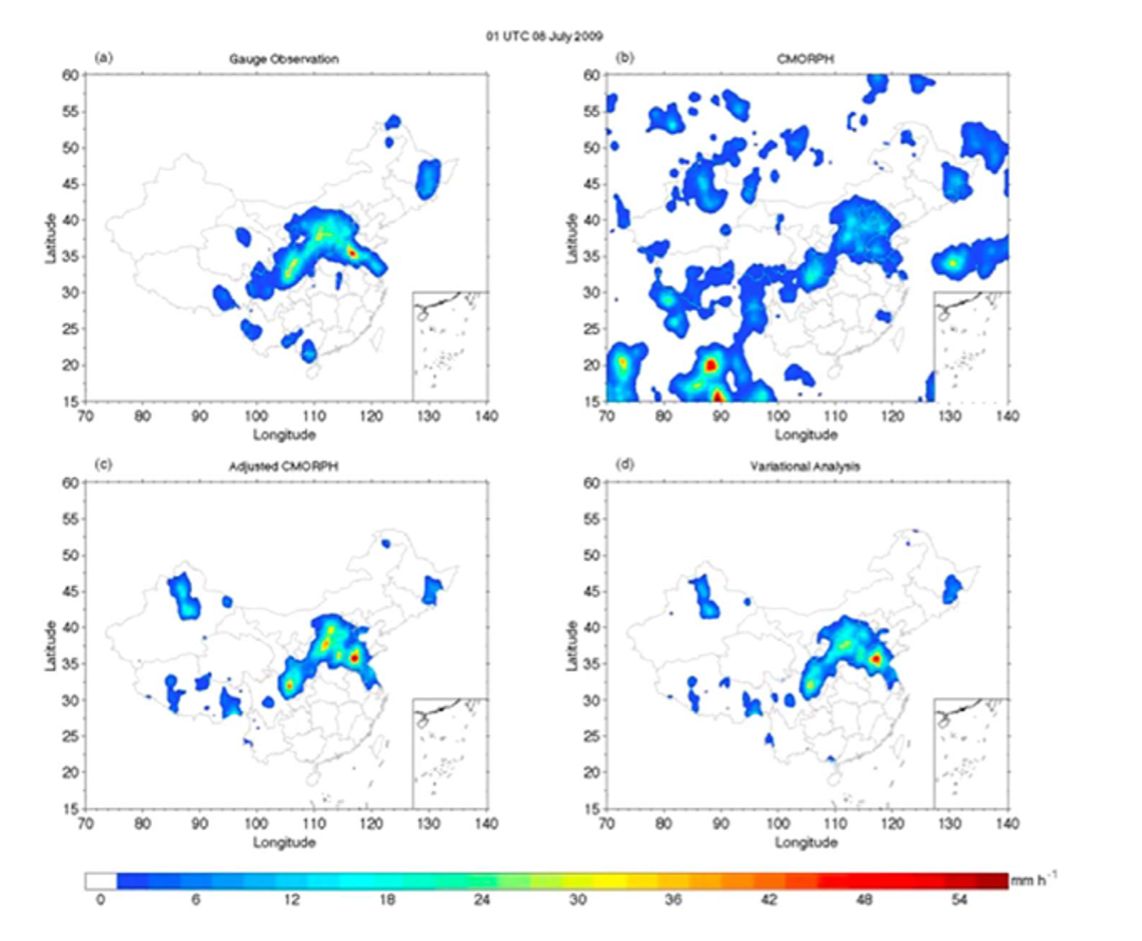
I developed the variational scheme that merges hourly rain-gauge observations with NOAA CMORPH satellite estimates into a 0.1 latitude/longitude precipitation analysis over mainland China, working with Dr. Jidong Gao at NOAA's National Severe Storms Laboratory. The scheme minimizes a cost function with a recursive-filter background term that spreads gauge information to nearby grid points, with the gradient obtained by the adjoint technique and the minimization by a quasi-Newton method; I wrote the implementation in Fortran.(Li, 2015, JGR-Atmos)

Cross-validation against withheld gauges showed that the analysis improves on satellite estimates, most of all where gauges are sparse. Satellite estimates capture heavy and extreme rainfall well but underestimate light rain; the merged analysis corrects the light-rain deficit where gauges exist and keeps the satellite's extreme-event rain structure where they do not (Li, 2016, IGARSS).

Li et al. (2015), Journal of Geophysical Research: Atmospheres, doi:10.1002/2015JD023710. With Y. Hong, P. Xie (NOAA CPC), J. Gao (NOAA NSSL), Z. Niu, P. Kirstetter and B. Yong.

Li, H (2016): Merged of gauge-satellite precipitation benefits to data-sparse regions and to extreme rainfall events. Proc. 2016 IEEE Int. Geosci. Remote Sens. Symp. (IGARSS), Beijing, doi:10.1109/IGARSS.2016.7729149.

Four maps of hourly precipitation over China: rain gauges, CMORPH, bias-adjusted CMORPH and the variational analysis.
Hourly precipitation at 01 UTC on 6 July 2009 from (a) rain gauges, (b) CMORPH, (c) bias-adjusted CMORPH and (d) the variational analysis. From Li et al. (2015), J. Geophys. Res. Atmos., 120, 9897–9915. © 2015 American Geophysical Union.
Four maps of hourly precipitation over China: rain gauges, CMORPH, bias-adjusted CMORPH and the variational analysis.
extreme rainfall.

Gauge-based daily rainfall products in China

2011, Research Intern, National Meteorological Information Center, China Meteorological Administration

Gauge-based daily rainfall products over China were constructed by optimal interpolation of 2,419 gauges on a 0.25 latitude/longitude grid for 1951–2010.

The stations measure rainfall with siphon or tipping-bucket gauges, record automatically, and pass quality control. The precipitation climatology used by the interpolation is adjusted with the Parameter-Elevation Regressions on Independent Slopes Model (PRISM) to correct the bias caused by orographic effects.

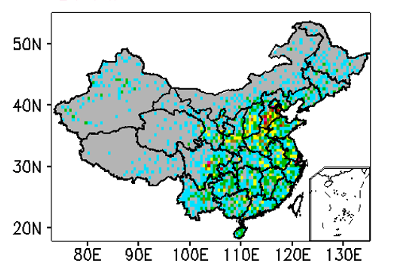
The analysis captures daily precipitation well over eastern China, where stations are relatively dense, while precipitation patterns may be distorted over western China, where analyzed values are interpolated from reports of distant stations.

Map of China showing the number of rain gauges per 0.25 degree grid box.
~2419 gauges density on the 0.25° rainfall products : dense in the east, sparse in the west